
Project controls, productised. An interactive, Excel-driven Earned Value dashboard that turns your weekly data into decision-ready insight — the S-curve, KPI gauges, quantities, man-hours, look-ahead and issue logs, all in one place.
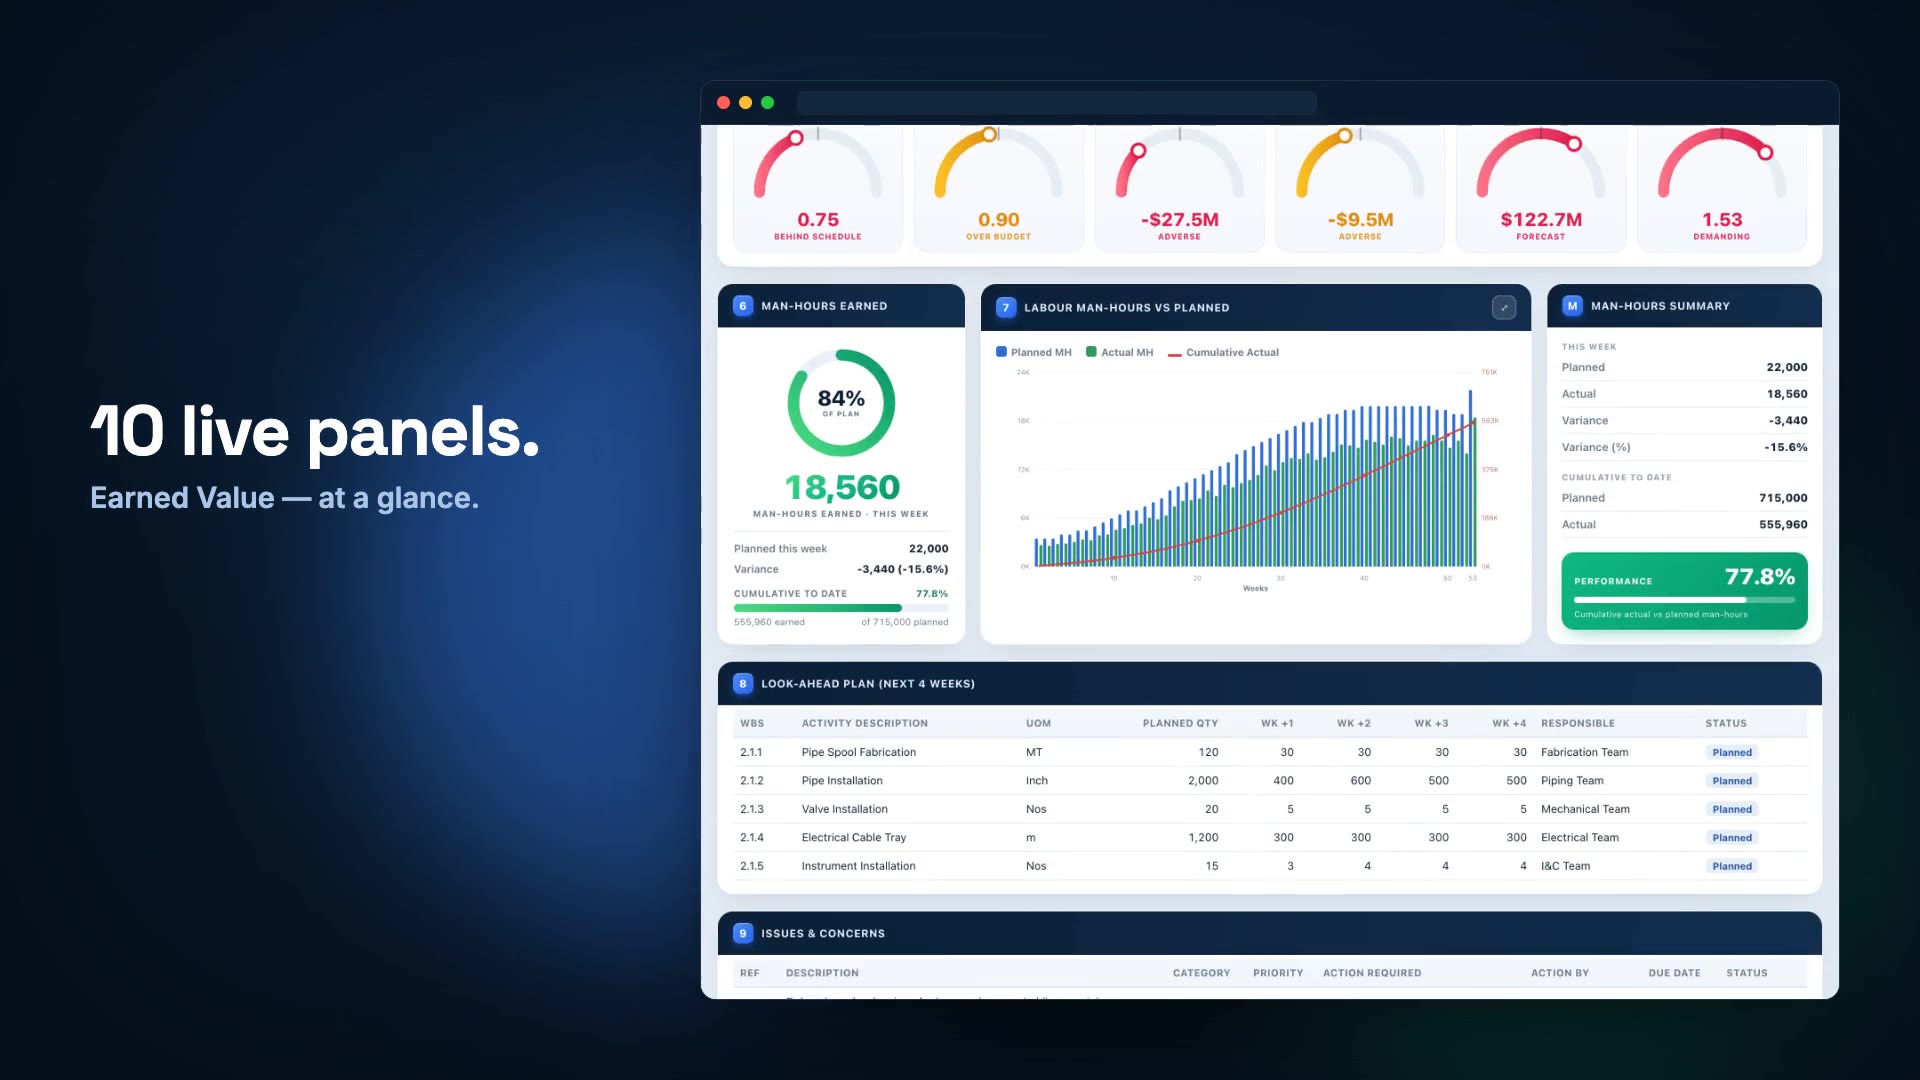
Built from years of project-controls practice, the Weekly Progress Report puts your whole project on one screen: planned, earned and actual cost on a live S-curve; every EVM metric computed for you; executed quantities, labour man-hours, a four-week look-ahead, and logs for issues and critical work.
You maintain a single Excel workbook — update it, load it, and the dashboard rebuilds itself. It runs entirely in a browser: no installation, no internet connection required, and your data never leaves your computer.
A 90-second tour of the dashboard and the value it brings.
A fully interactive sample below — hover the charts, expand a panel, explore the data. This is exactly what you get.
Everything a weekly progress report needs — driven by one workbook.
Planned, earned and actual cost on one live curve — with SPI, CPI, SV, CV, EAC and TCPI computed for you.
Modern, colour-coded performance gauges that read your project's health at a glance.
Executed quantities tracked against plan, and labour man-hours — earned, planned versus actual, and cumulative.
A rolling four-week plan, plus issue and critical-item logs with priority, owners, due dates and overdue flags.
Maintain one workbook. Update, load, and the whole dashboard rebuilds itself — no formulas to wrangle.
Runs entirely in your browser. No installation, no internet needed, and your data never leaves your computer.
Get the Weekly Progress Report dashboard set up for your projects — branded to your organisation, with a quick handover and guide.